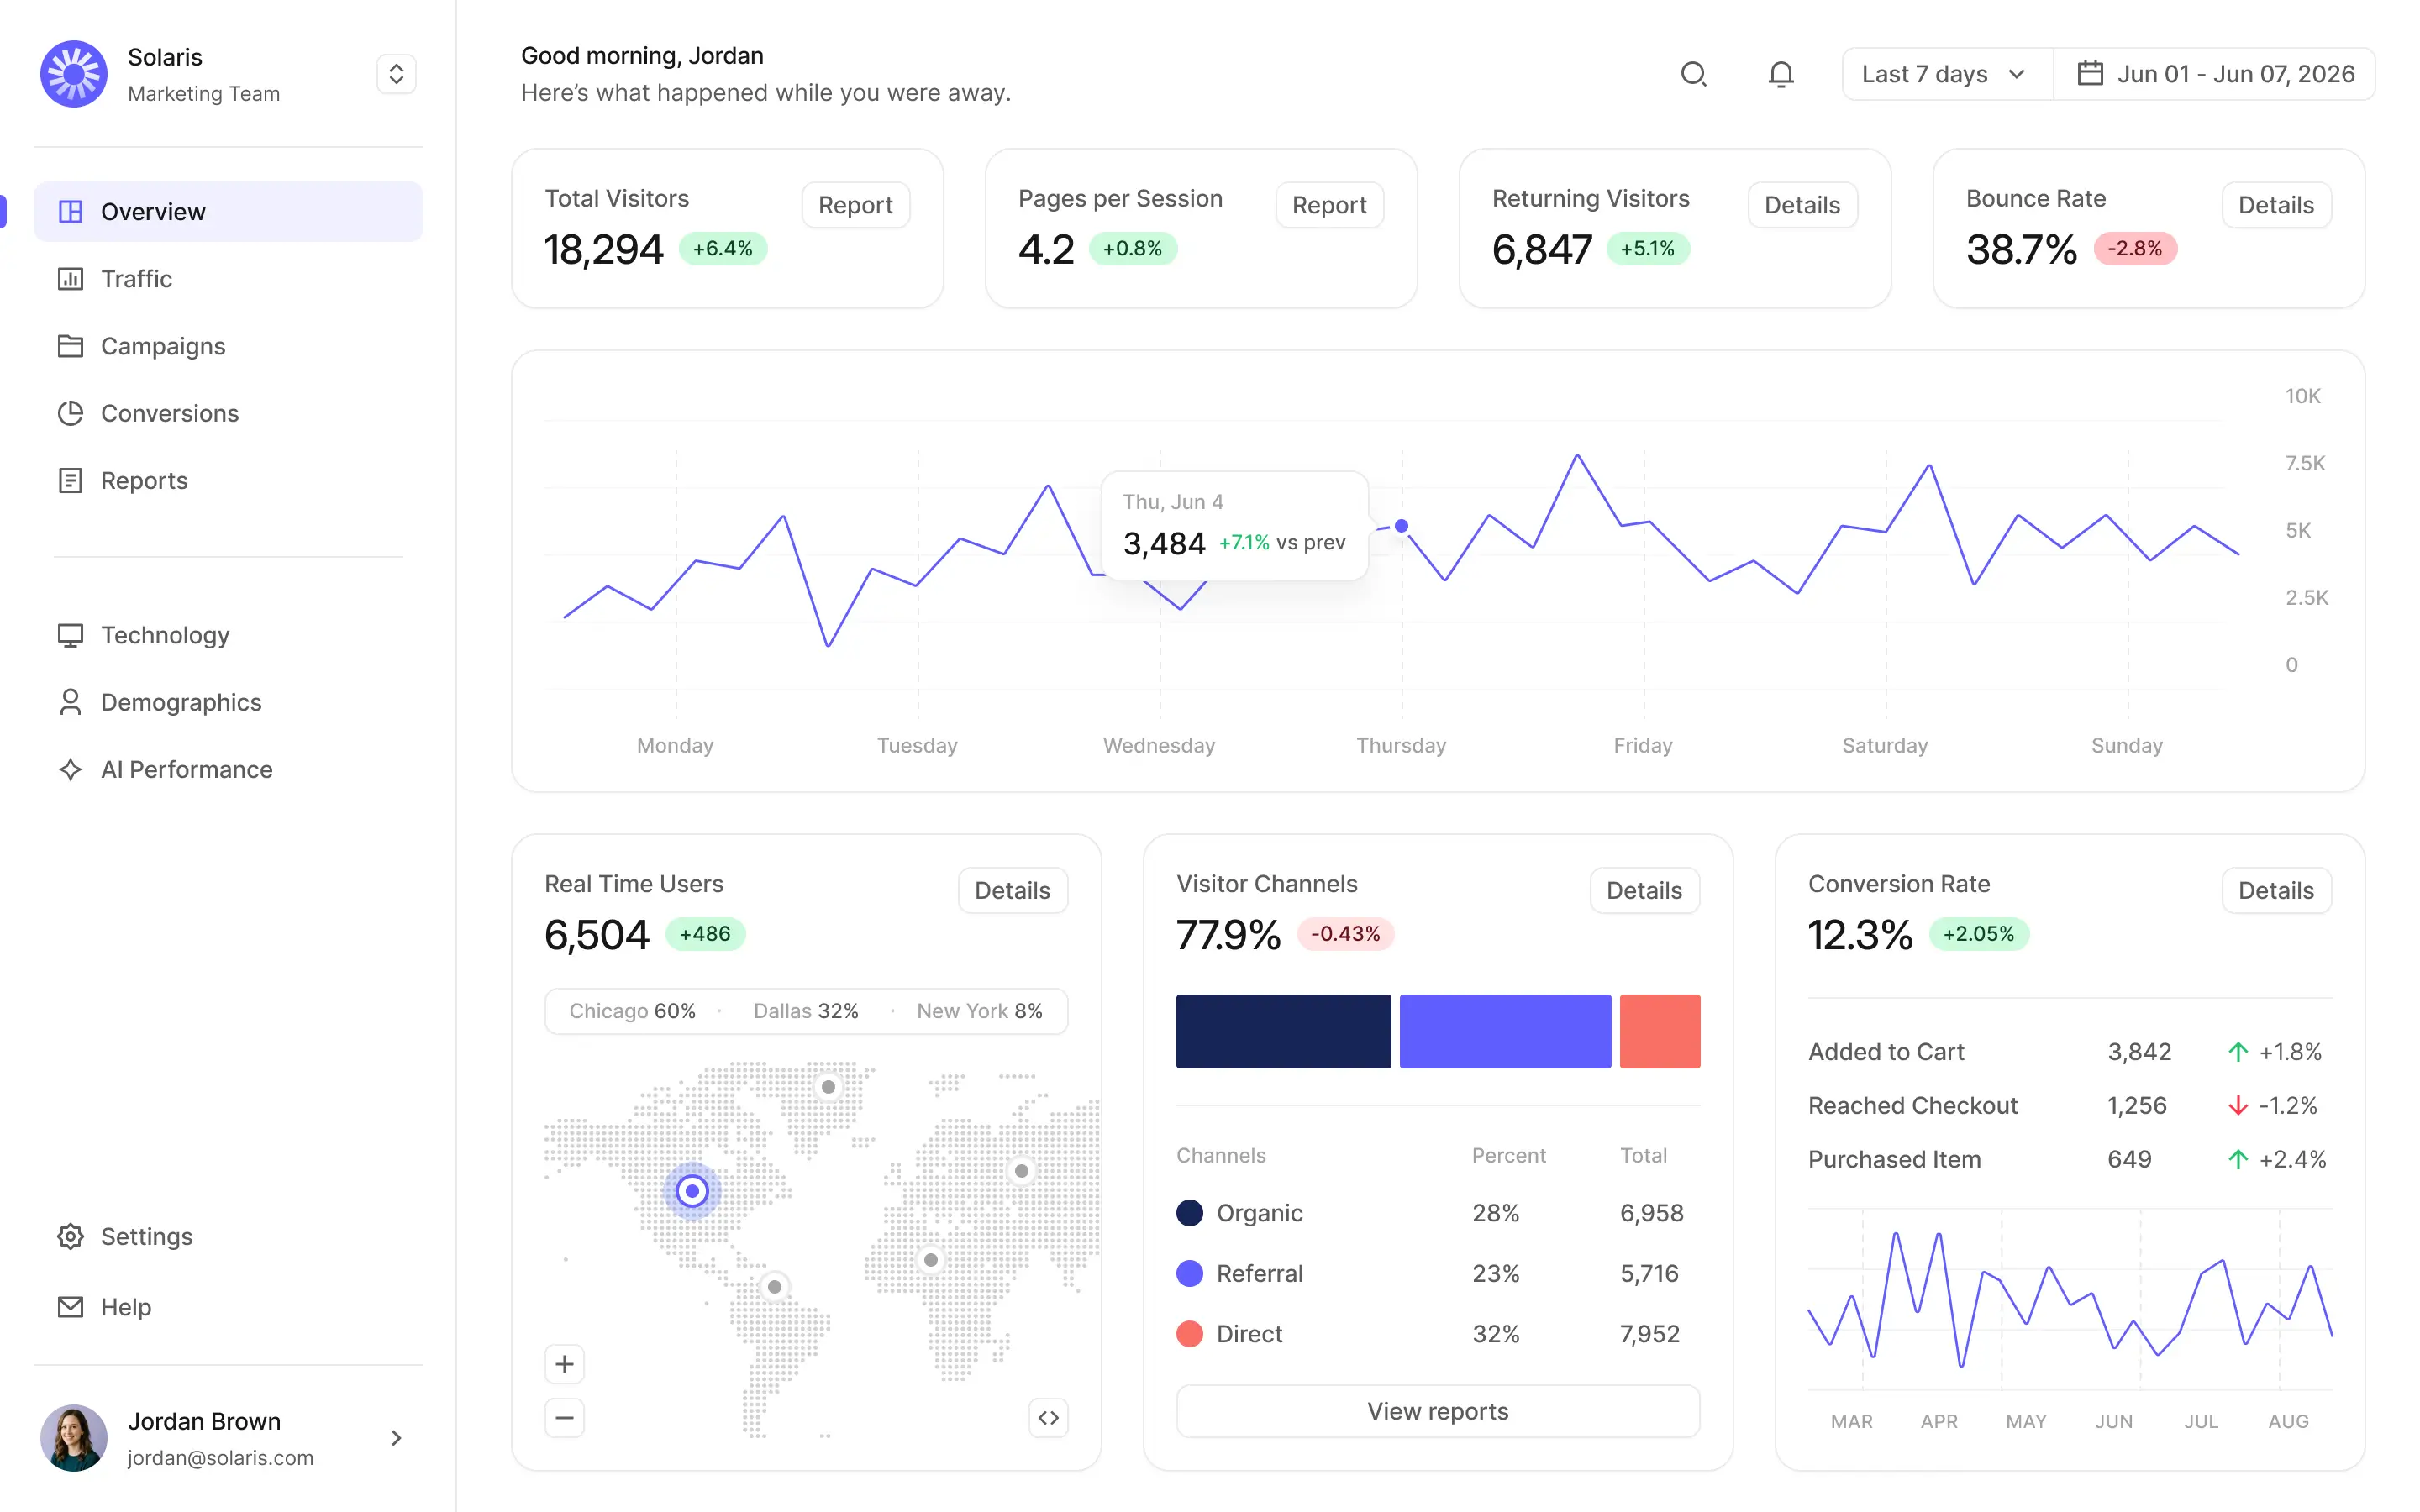
Web analytics your marketing team will actually use

Most analytics tools were built for data teams. Chartwise was built for the people running campaigns, writing landing pages, and trying to hit a number by Friday.

Analytics dashboard showing website traffic, visitor channels, conversion rate, and user activity insights.

Trusted by marketing teams

Built for marketers

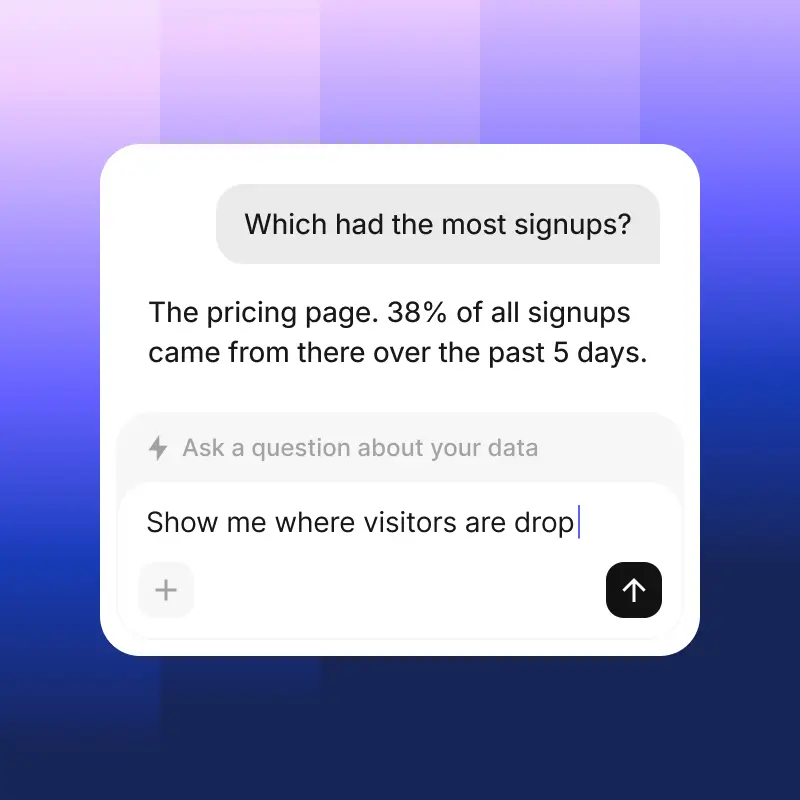
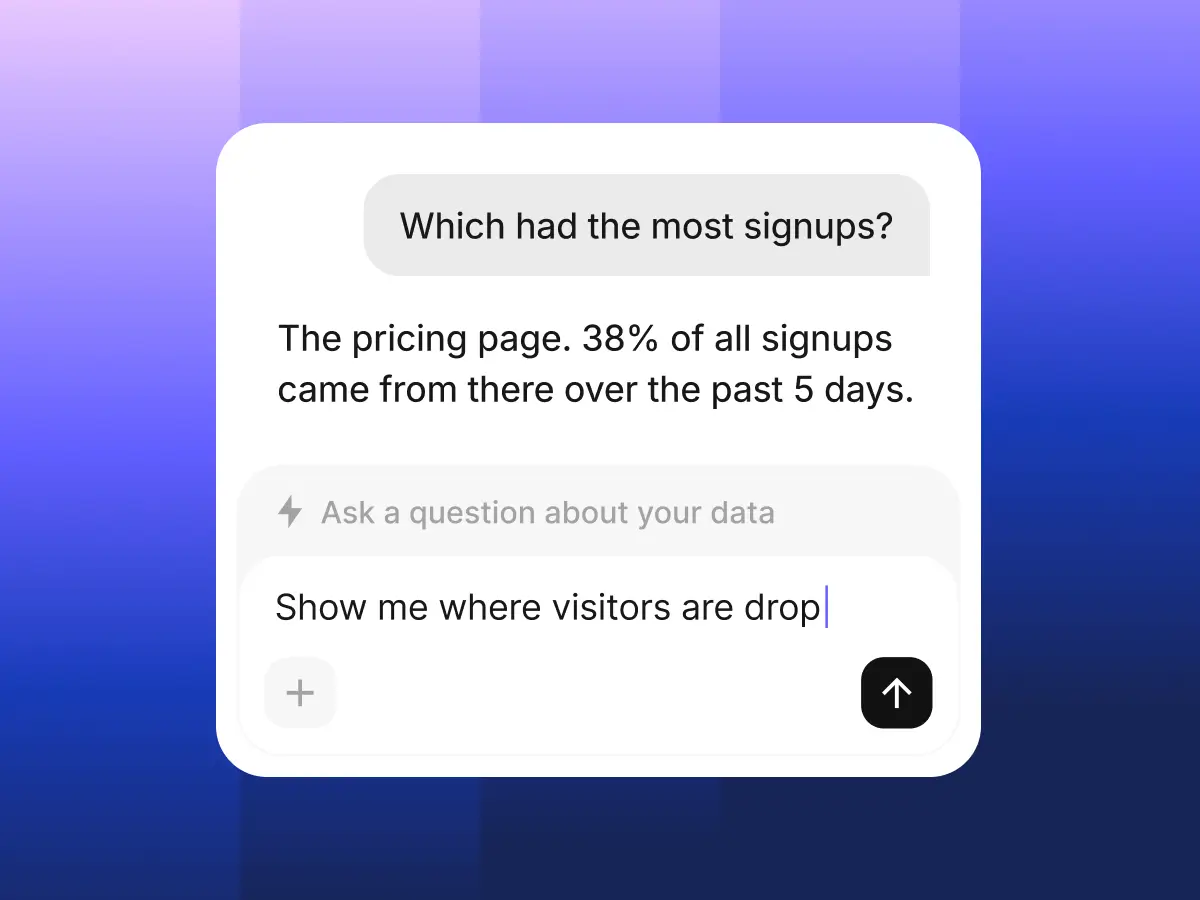
The answers your marketing team has been looking for

Analytics card showing website traffic sources over the last 7 days, including Google, YouTube, Framer, Facebook, and LinkedIn, on a blue-purple gradient background.

Know where your buyers come from

Chartwise breaks down your traffic by source and shows you which channels convert so you know where to invest.

Analytics card showing a 3.04% conversion rate with a 2.1% increase, plus cart, checkout, and purchase metrics on a blue-purple gradient background.

Metrics that actually matter

Skip the vanity numbers. Chartwise surfaces signups, activations, and conversions in one dashboard.

Analytics card showing a 3.04% conversion rate with a 2.1% increase, plus cart, checkout, and purchase metrics on a blue-purple gradient background.

Metrics that actually matter

Skip the vanity numbers. Chartwise surfaces signups, activations, and conversions in one dashboard.

AI analytics card showing a user asking which page had the most signups, with a response highlighting the pricing page and a prompt input below.

Answers in seconds, not days

Anyone on your team can ask Chartwise a question in plain English and get a clear chart back immediately. No SQL required.

AI analytics card showing a user asking which page had the most signups, with a response highlighting the pricing page and a prompt input below.

Answers in seconds, not days

Anyone on your team can ask Chartwise a question in plain English and get a clear chart back immediately. No SQL required.

Your marketing hub

All your traffic and campaigns in one place

Marketing analytics dashboard showing traffic data, page views, marketing channels, and top sources in a clean web app interface on a blue-purple gradient background.

Set up in minutes

Drop one line of code into your site and start tracking immediately. No engineering ticket or setup call required.

Real-time, always

See live visitor counts, active campaigns, and today’s conversions updating the moment they happen.

Marketing dashboard cards showing campaign metrics for visitors, signups, purchases, traffic channels, and referral totals on a blue-purple gradient background.

What Chartwise does

The features your team will use every day

Campaign tracking

See how every campaign performs from first click to signup. Chartwise tags traffic by source automatically so you always know which campaigns are worth the budget.

Traffic sources

See exactly where your visitors come from. Chartwise breaks down every session by channel so you can compare organic, paid, email, and social side by side.

Top pages

See which pages on your site actually drive signups. Chartwise ranks every page by conversion rate so you know what to promote, update, or cut.

“We tried three analytics tools before Chartwise. This is the first one the whole team actually logs into every morning.”

Summer Reyes

VP of Marketing

As featured in

“The simplest analytics tool we’ve seen built for marketers.”

Source: Press Network

4.8/5

average rating from marketing teams across 600+ reviews

87%

of teams say they make faster decisions after using Chartwise

Additional features

Everything you need, nothing you don’t

Get notified automatically

Watch your key metrics without watching a dashboard. Automatic alerts land in Slack whenever something changes like a drop in conversions, or a campaign taking off.

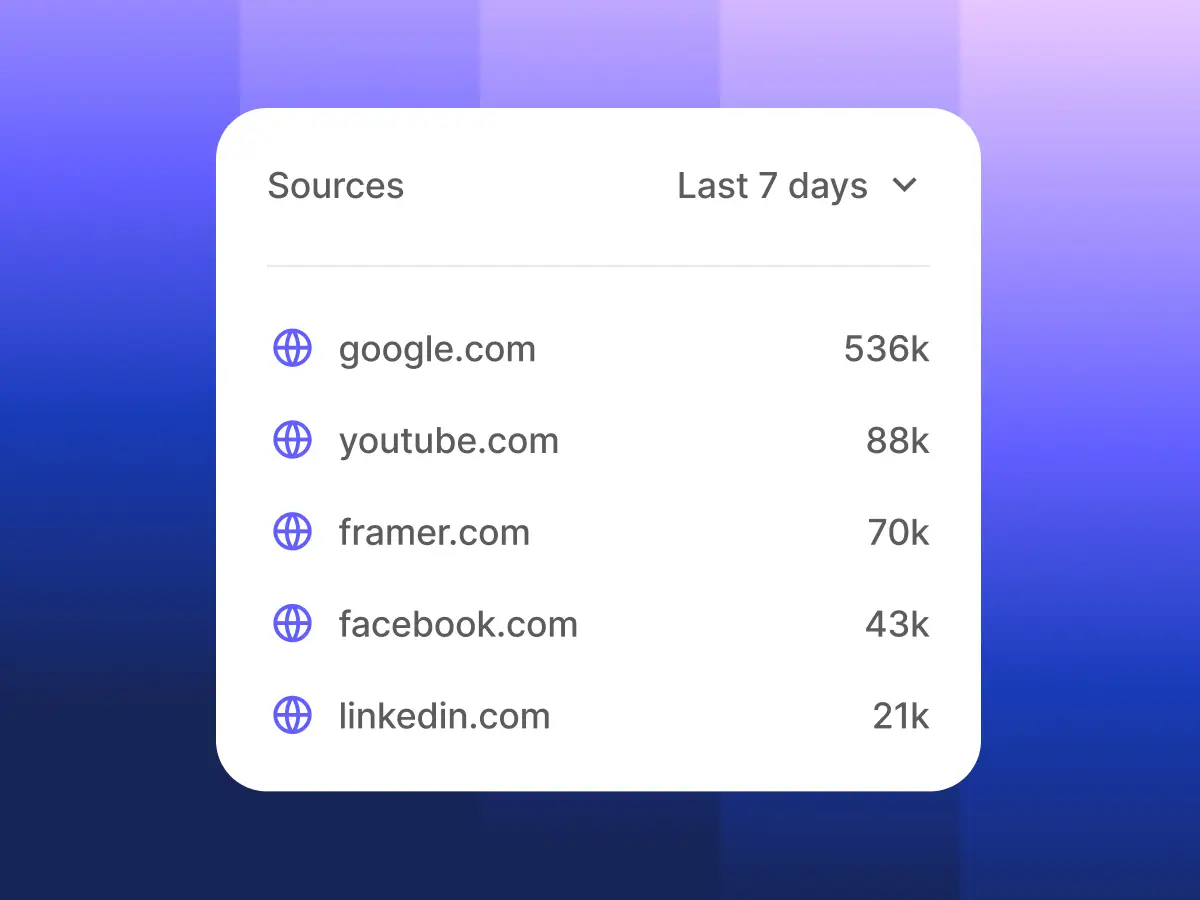
Campaign tags, handled

UTM parameters (the tags that identify where traffic came from) are read and organised automatically so every campaign is tracked without any extra configuration.

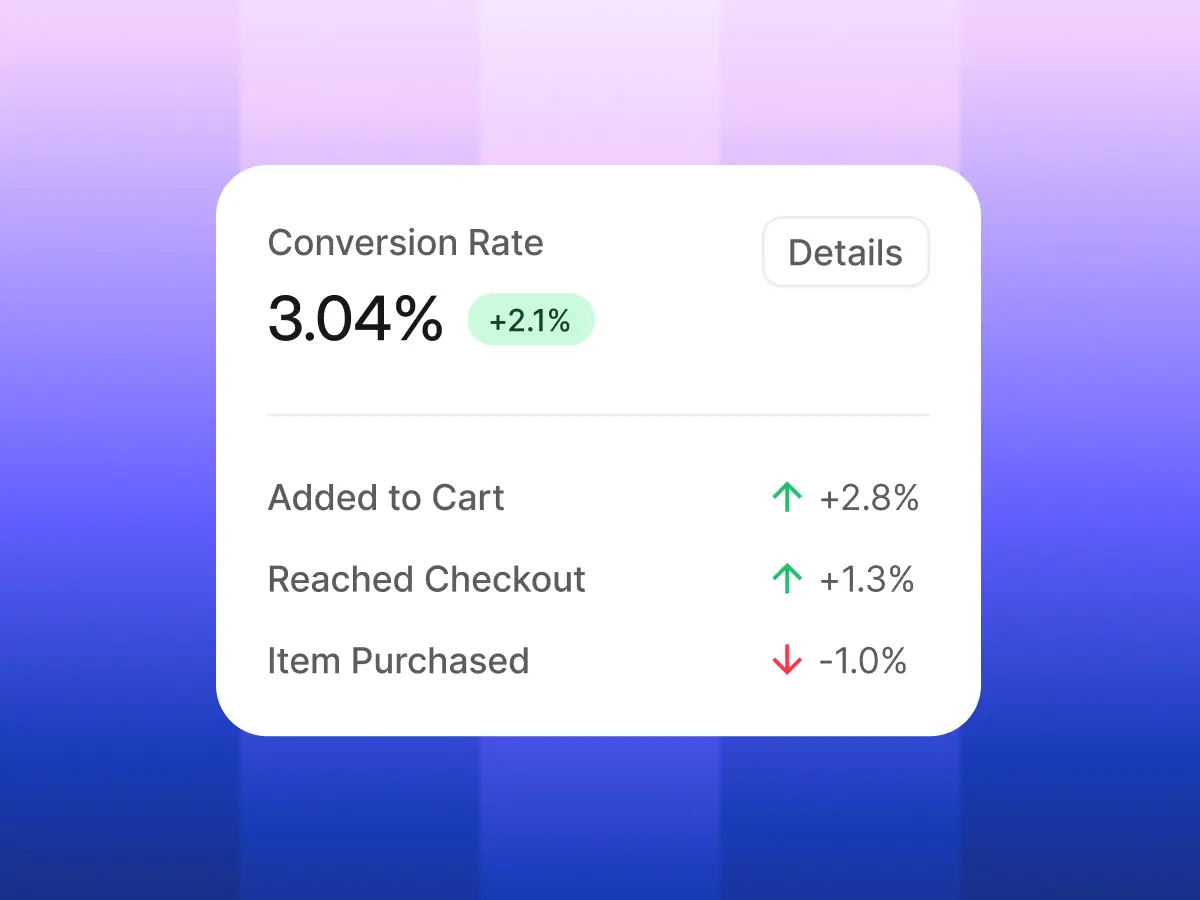
Measure what matters to you

Define what a successful visit looks like a signup, a demo request, a purchase and track progress toward that goal across every page and channel automatically.

Reports your team will actually read

Build a report once and share it with the whole team. Everyone sees the same numbers in the same format with no more reconciling different spreadsheets.

GDPR compliant out of the box

Cookie less tracking means no consent banner required for basic analytics. Visitor data is never sold or shared with third parties and stays fully under your control.

Works with your existing stack

Native integrations with Slack, HubSpot, Notion, and more mean your data flows where the team needs it without any manual exports or extra configuration.

Pricing that scales with you

Monthly

Yearly (save 20%)

Starter

For solo marketers and small teams

$29.95

$36.99

/ month

billed yearly (save $84)

billed monthly

  • 3 websites

  • Up to 250,000 monthly visits

What’s included:

Real time dashboards and reporting

Campaign and UTM tracking

Basic AI insights

Email support

Growth

For teams ready to scale up

$79.95

$99.99

/ month

billed yearly (save $240)

billed monthly

  • 10 websites

  • Unlimited monthly visits

Everything in Starter, plus:

Custom dashboards and reports

Session replay and heatmaps

Advanced AI insights

Priority support

Frequently Asked Questions

Frequently Asked Questions

Good questions, honest answers

Good questions, honest answers

How long does setup actually take?

Most teams are up and running in under ten minutes. Paste one line of code into your site and data starts flowing immediately. No tag manager, no configuration calls, no waiting on engineering.

Do I need to add a cookie banner?

No. The tracking is cookie less by default, which means it collects anonymous visit data without storing anything in a visitor's browser. Most teams can run basic analytics without a consent banner at all.

How is this different from Google Analytics?

Google Analytics was built for SEO and ad attribution. This was built for marketing teams who want to understand what drives signups and conversions. Simpler to use, cleaner data, and no sampling on smaller plans.

Can my whole team use it?

Yes, every plan includes unlimited team members. Anyone on your team can log in, build reports, and share dashboards without needing a separate seat or a technical background to make sense of what they see.

What happens if I go over my visit limit?

Nothing breaks. Data keeps being collected and you get a notification that you are approaching your limit. You have two weeks to upgrade or reduce volume before anything is paused. No surprise charges, ever.

Can I export my data?

Yes. Every plan includes CSV exports and the Growth plan adds direct integrations with tools like HubSpot, Notion, and Slack. Your data belongs to you and you can take it with you at any time.

Your team deserves better analytics

Join thousands of marketing teams who swapped complicated dashboards for answers they can actually act on. Free to start, no credit card required.

Web analytics dashboard showing traffic, visitor, conversion, and channel metrics for a marketing team, with charts, reports, and a sidebar navigation.

Create a free website with Framer, the website builder loved by startups, designers and agencies.